EViews 13 Just Released

What's New in EViews 13
EViews 13 features a wide range of exciting changes and improvements (both in Econometrics and non-econometric). The following is an overview of the most important new features in Version 13.
Updated Interface and Programming Support
- Pane and Tab alternative user interface.
- Program Language Debugging.
- Jupyter Notebook Support.
- Program dependency tracking.
Data Handling
- Daily seasonal adjustment.
- Improved Excel writing engine.
- World Health Organisation connectivity.
- Trading Economics connectivity.
- National statistical bureaus connectivity
- Holiday function improvements.
- Miscellaneous Improvements.
New Graph, Table and Geomap Features
- Line and Shade Transparency.
- Custom Data Labels.
- High-low-median Colormap Presets.
- Miscellaneous Improvements.
Econometrics and Statistics - Estimation
- Non-linear ARDL Estimation.
- Improved PMG Estimation.
- Difference-in-Difference Estimation.
- Improved VEC Estimation.
- Bayesian Time-varying Coefficient Vector Autoregression.
Econometrics and Statistics - Testing & Diagnostics
- Cointegration Testing Enhancements.
- ARDL Diagnostics.
- Pool Mean Group / Panel ARDL Diagnostics.
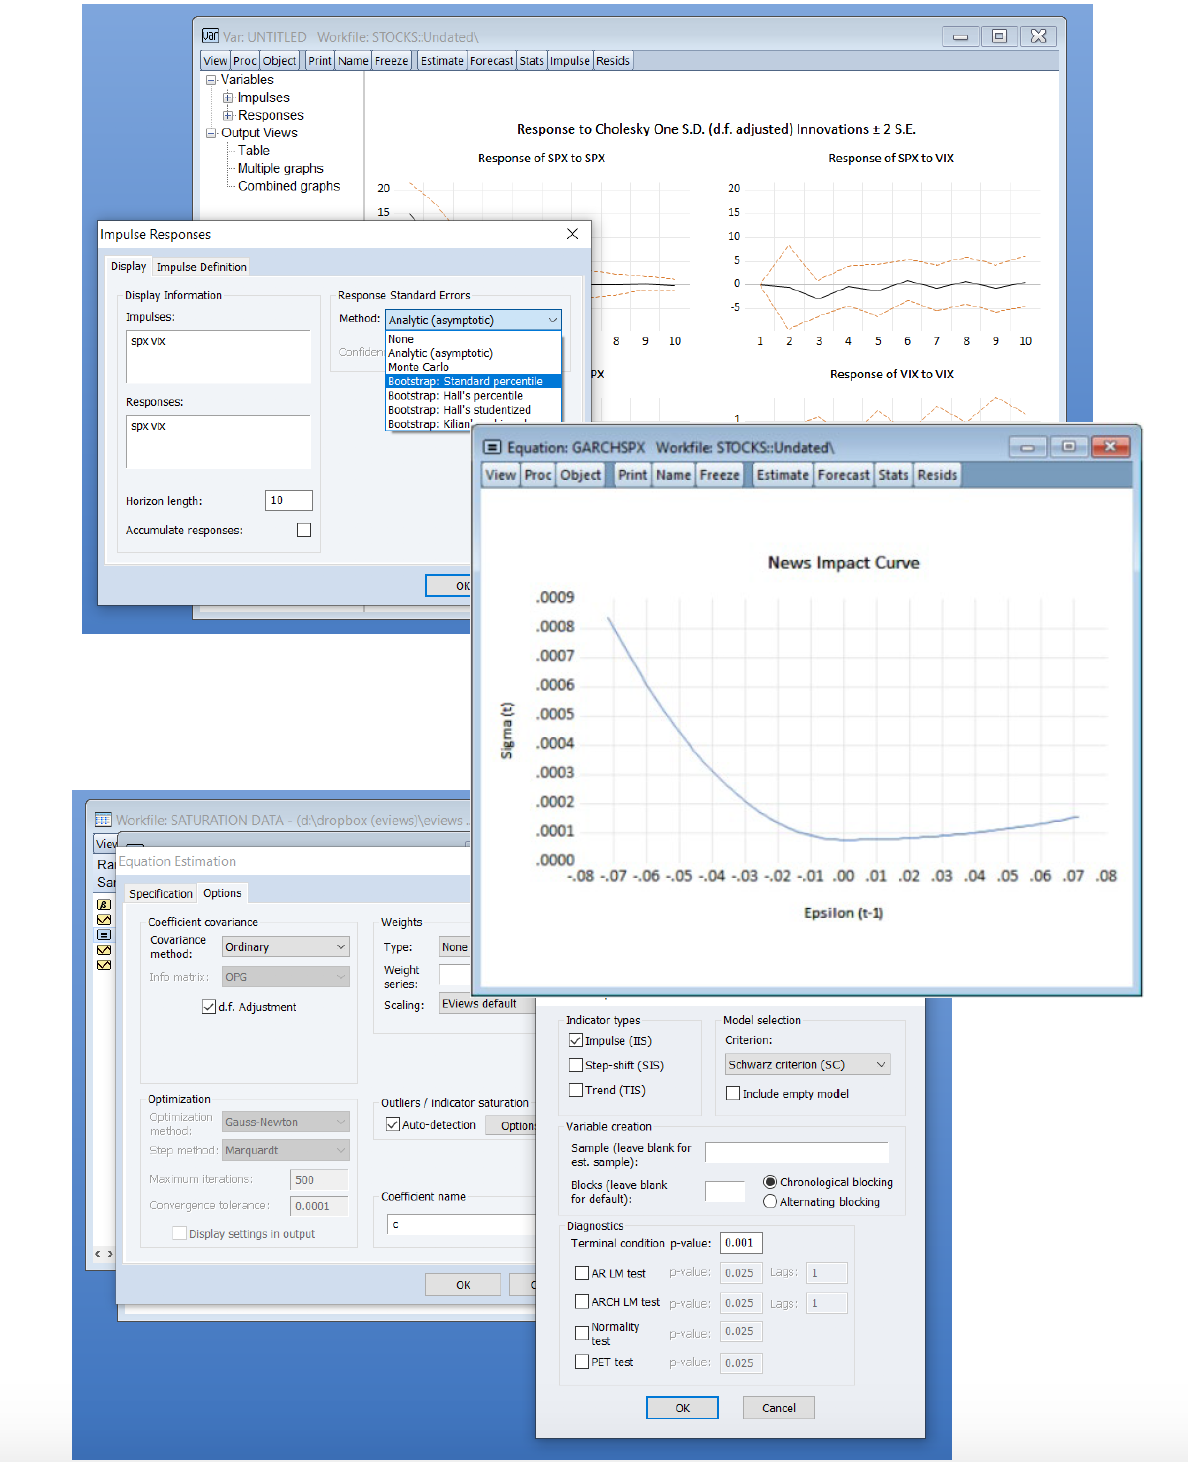
- Enhanced Impulse Response Display.
Free EViews 13 New Features Webinar
Join expert EViews user and econometrician Dr Malvina Marchese for a live and comprehensive introduction to EViews 13. This webinar will give you the boost that you need to get started using EViews 13 efficiently and effectively. Click here to sign up.
What is EViews?
EViews is a software package for quickly and efficiently managing data, performing econometric and statistical analysis, generating forecasts or model simulations, and producing high-quality graphs and tables for publication or inclusion in other applications. With its intuitive graphical object-oriented user interface and a powerful analysis engine, EViews blends modern software design with the features you need.
EViews is an easy-to-use, Windows-based statistical analysis package employed worldwide by economists, financial analysts, market researchers, and policy analysts. EViews supports these researchers in a wide range of tasks, from analysing economic and financial data, building models and “what if” scenarios, to conducting research and teaching econometrics, and estimating the impact of new policies or major investment changes. You too can take advantage of the power and simplicity of EViews.
EViews offers the statistical and econometric tools you need for analysing time series, cross-sectional, and panel data. From basic descriptive statistics, measures of association, tests-of-equality, and principal components, to specialised features such as long-run variance calculation, causality testing, and unit root and co-integration diagnostics, EViews offers a wide range of tools for exploring the properties of your data. Our estimation support begins with basic tools such as single and multiple equation linear and nonlinear least squares, ARMA, instrumental variables and exponential smoothing, and extends to more specialised estimators such as Generalised Method of Moments, univariate and multivariate GARCH, Markov switching, non-stationary regression, vector autoregression and vector error correction, and state-space estimation. And that’s just for starters. EViews even offers advanced tools for both stationary and non-stationary panel data analysis.
Purchase or Upgrade your EViews licence today.