Fast. Accurate. Easy to use. Stata is a complete, integrated software package that provides all your data science needs—data manipulation, visualization, statistics, and automated reporting.
Why Stata?
Fast. Accurate. Easy to use. Stata is a complete, integrated software package that provides all your data science needs—data manipulation, visualization, statistics, and automated reporting.
- Master your data
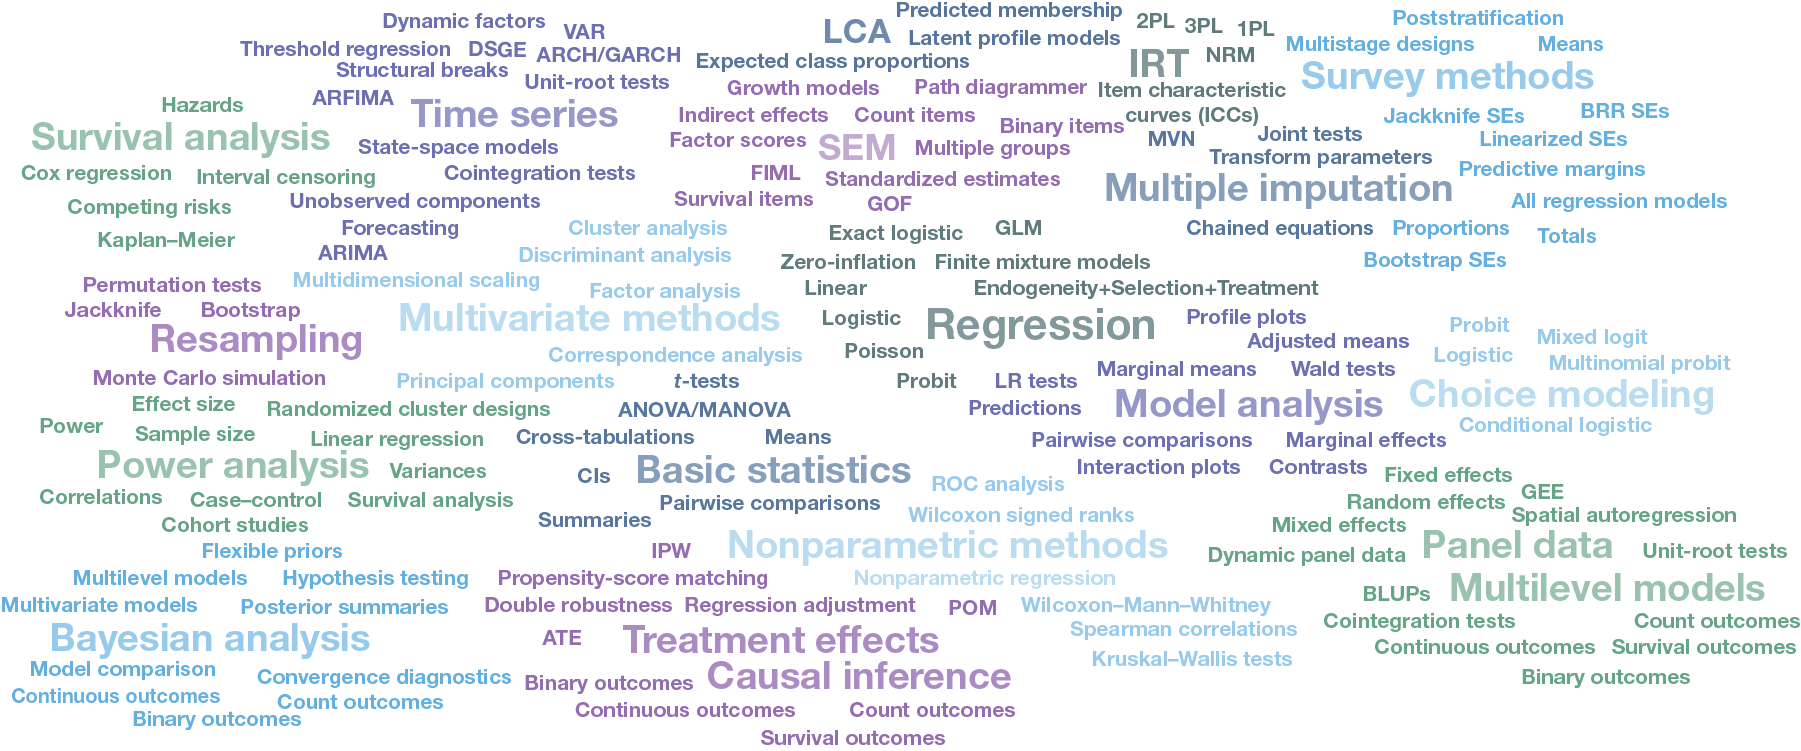
- Broad suite of statistical features
- Publication-quality graphics
- Automated reporting
- Truly reproducible research
- Real documentation
- Trusted
- Easy to use
- Easy to grow with
- Easy to automate
- Easy to extend
- Advanced programming
- Automatic multicore support
- Community-contributed features
- World-class technical support
- Cross-platform compatible
- Widely used
- Comprehensive resources
- Vibrant community
- Affordable
Master your data
Stata's data management features give you complete control.
- Frames — manage multiple datasets simultaneously
- Import, export
- JDBC, ODBC, SQL
- Sort, match, merge, join, append, create
- Built-in spreadsheet
- Unicode
- Process text or binary data
- Access data locally or on the web
- Collect statistics across groups
- BLOBs—strings that can hold entire documents
- Billions of observations
- Hundreds of thousands of variables
- Survival data, panel data, multilevel data, survey data, discrete choice data, multiple-imputation data, categorical data, time-series data
And much more, to support all your data science needs.

Broad suite of statistical features
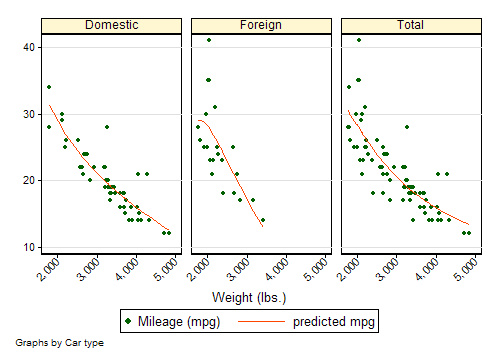
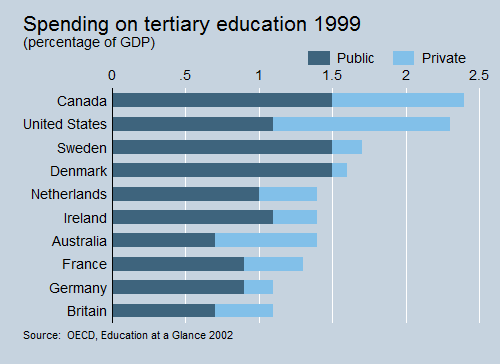
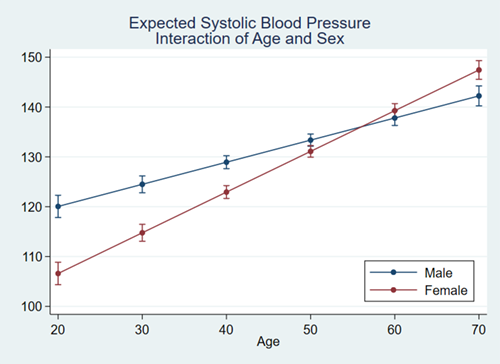
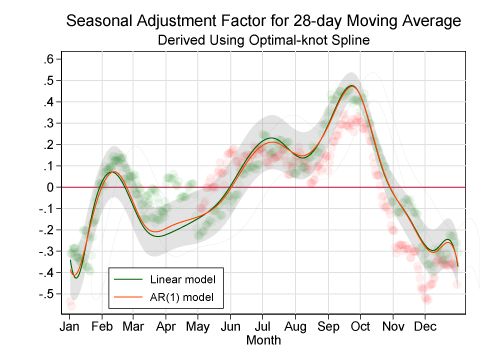
Publication-quality graphics
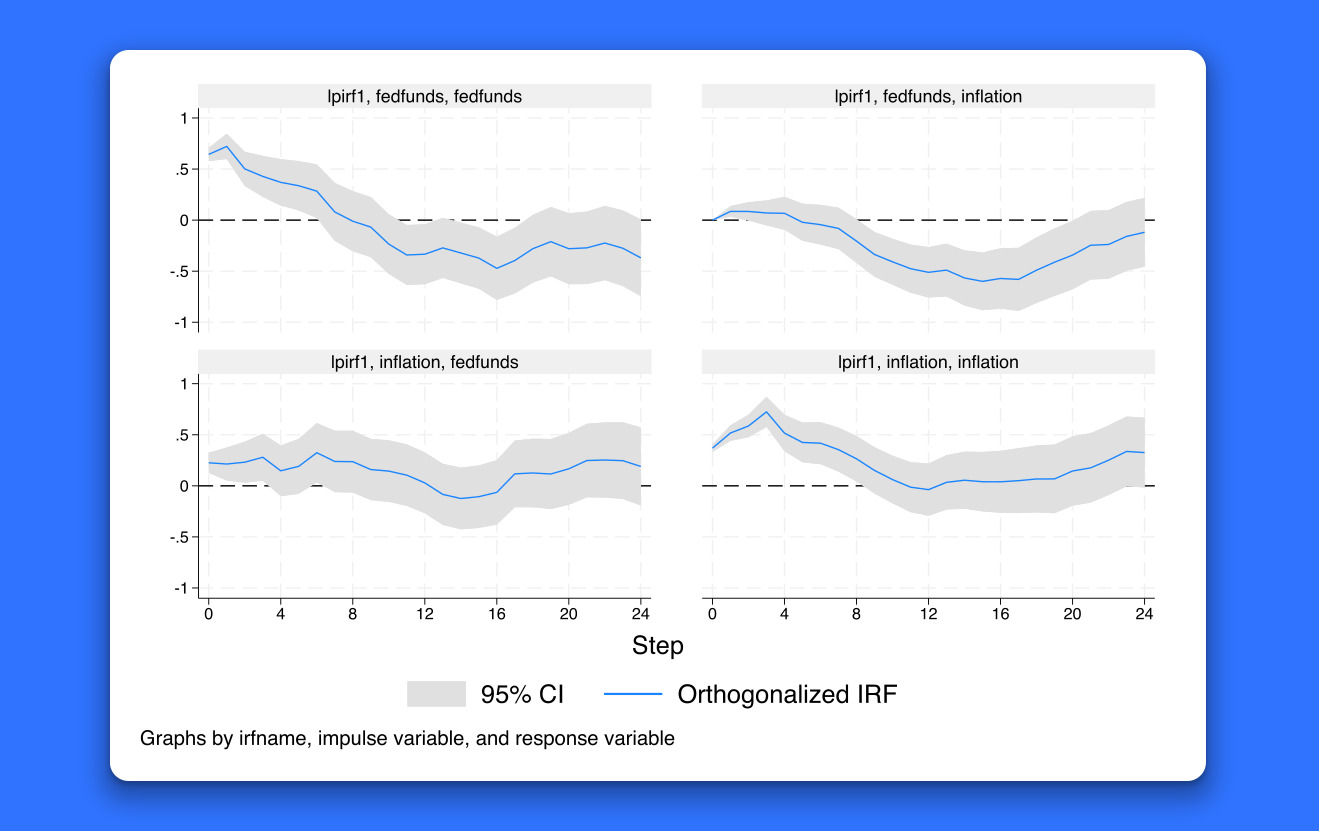
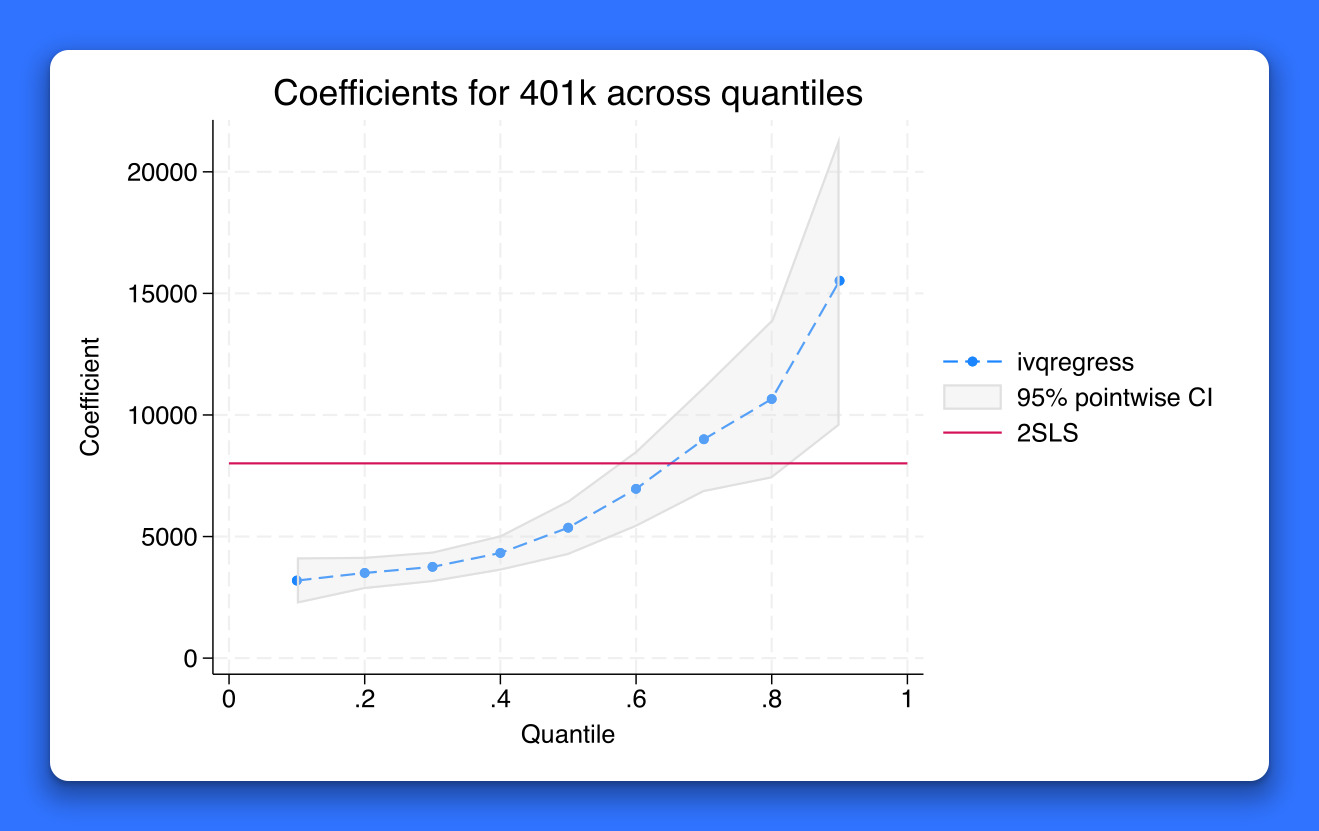

Stata makes it easy to generate publication-quality, distinctly styled graphs.
You can point and click to create a custom graph. Or you can write scripts to produce hundreds or thousands of graphs in a reproducible manner. Export graphs to EPS or TIFF for publication, to PNG or SVG for the web, or to PDF for viewing. With the integrated Graph Editor, you click to change anything about your graph or to add titles, notes, lines, arrows, and text.
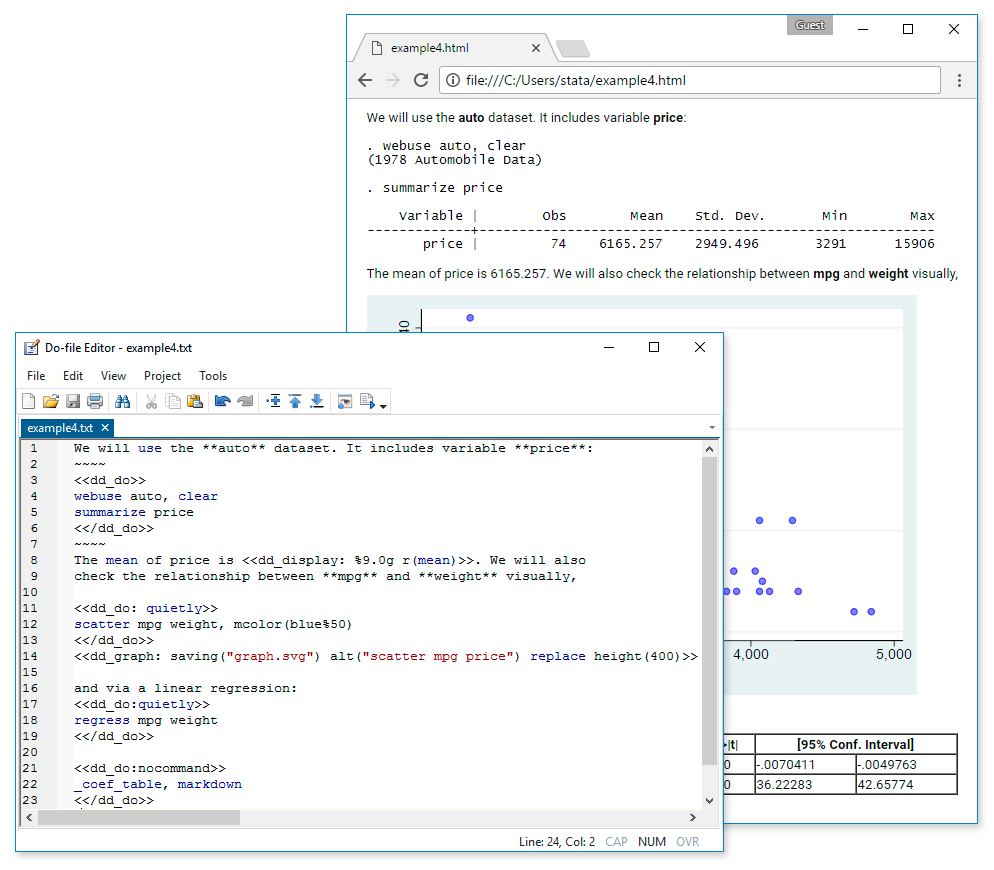
Automated reporting
All the tools you need to automate reporting your results.
- Dynamic Markdown documents
- Create Word documents
- Create PDF documents
- Create Excel files
- Customizable tables
- Schemes for graphics
- Word, HTML, PDF, SVG, PNG
Truly reproducible research
Lots of folks talk about reproducible research.
Stata has been dedicated to it for over 30 years.
We constantly add new features; we have even fundamentally changed language elements. No matter. Stata is the only statistical package with integrated versioning. If you wrote a script to perform an analysis in 1985, that same script will still run and still produce the same results today. Any dataset you created in 1985, you can read today. And the same will be true in 2050. Stata will be able to run anything you do today.
We take reproducibility seriously.
Real documentation
When it comes time to perform your analyses or understand the methods you are using, Stata does not leave you high and dry or ordering books to learn every detail.
Each of our data management features is fully explained and documented and shown in practice on real examples. Each estimator is fully documented and includes several examples on real data, with real discussions of how to interpret the results. The examples give you the data so you can work along in Stata and even extend the analyses. We give you a Quick start for every feature, showing some of the most common uses. Want even more detail? Our Methods and formulas sections provide the specifics of what is being computed, and our References point you to even more information.
Stata is a big package and so has lots of documentation – over 18,000 pages in 35 manuals. But don't worry, type help my topic, and Stata will search its keywords, indexes, and even community-contributed packages to bring you everything you need to know about your topic. Everything is available right within Stata.
Trusted
We don't just program statistical methods, we validate them.
The results you see from a Stata estimator rest on comparisons with other estimators, Monte Carlo simulations of consistency and coverage, and extensive testing by our statisticians. Every Stata we ship has passed a certification suite that includes 4.1 million lines of testing code that produces 5.8 million lines of output. We certify every number and piece of text from those 5.8 million lines of output.
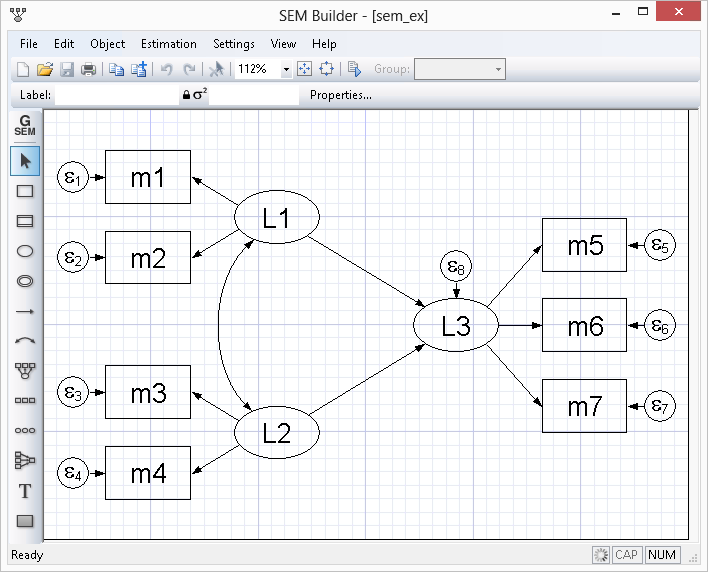
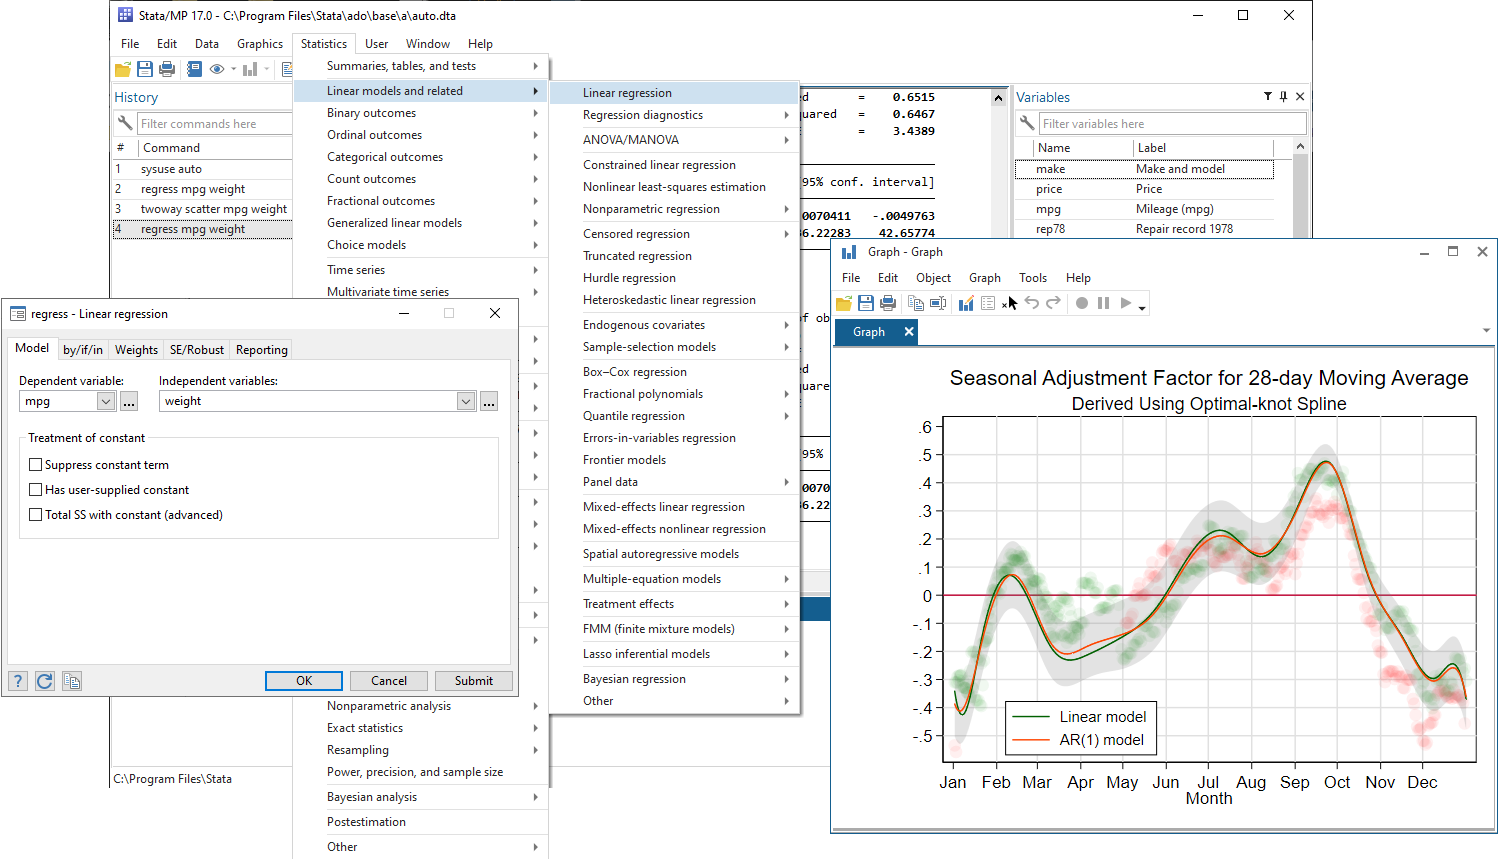
Easy to use
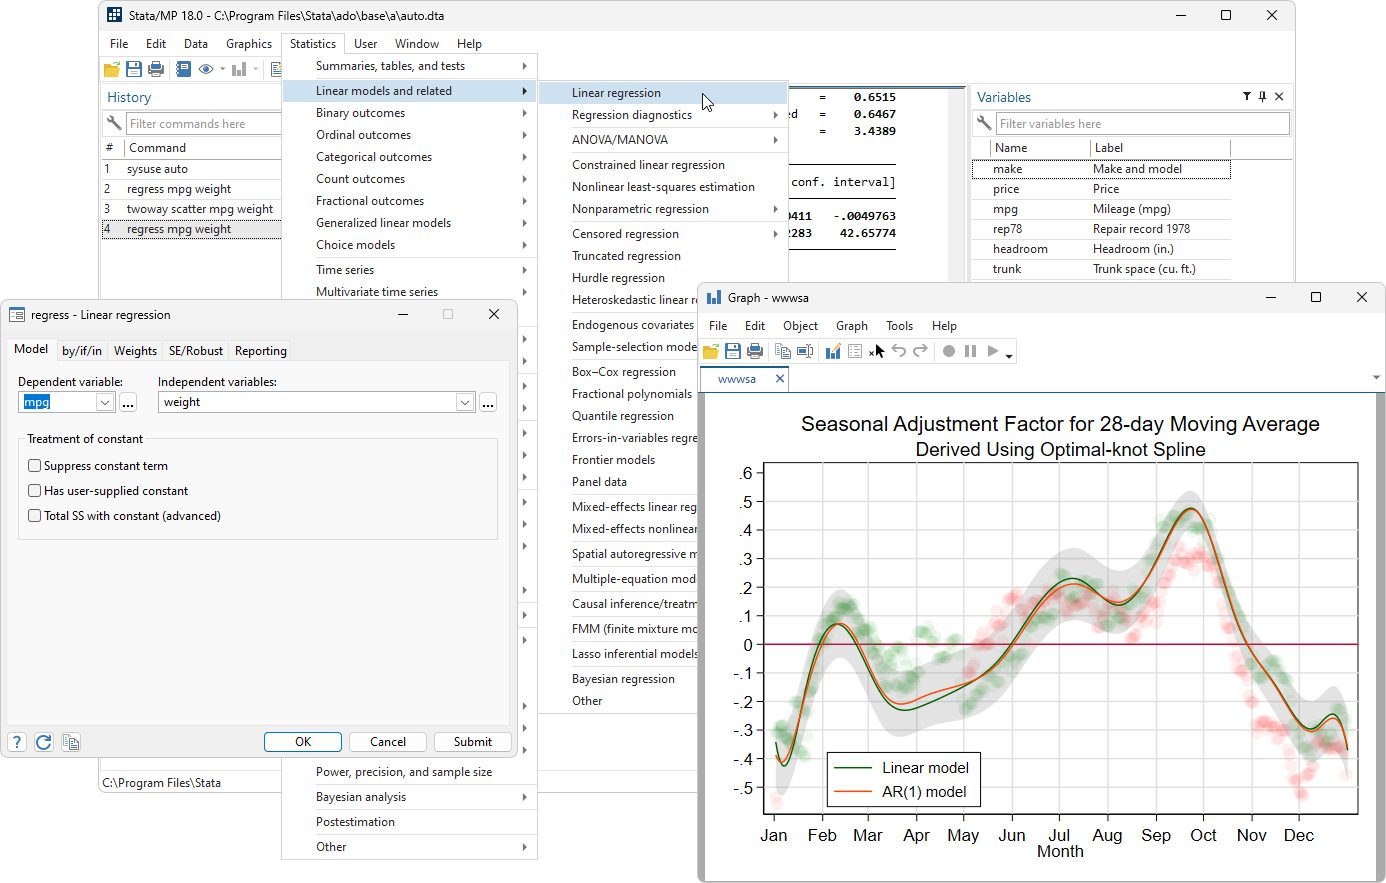
All of Stata's features can be accessed through menus, dialogs, control panels, a Data Editor, a Variables Manager, a Graph Editor, and even an SEM Diagram Builder. You can point and click your way through any analysis.
If you don't want to write commands and scripts, you don't have to.
Even when you are pointing and clicking, you can record all your results and later include them in reports. You can even save the commands created by your actions and reproduce your complete analysis later.
Easy to grow with
Stata's commands for performing tasks are intuitive and easy to learn. Even better, everything you learn about performing a task can be applied to other tasks. For example, you simply add if gender=="female" to any command to limit your analysis to females in your sample. You simply add vce(robust) to any estimator to obtain standard errors and hypothesis tests that are robust to many common assumptions.
The consistency goes even deeper. What you learn about data management commands often applies to estimation commands, and vice-versa. There is also a full suite of postestimation commands to perform hypothesis tests, form linear and nonlinear combinations, make predictions, form contrasts, and even perform marginal analysis with interaction plots. These commands work the same way after virtually every estimator.
Sequencing commands to read and clean data, then to perform statistical tests and estimation, and finally to report results is at the heart of reproducible research. Stata makes this process accessible to all researchers.
Easy to automate
Everyone has tasks that they do all the time—create a particular kind of variable, produce a particular table, perform a sequence of statistical steps, compute an RMSE, etc. The possibilities are endless. Stata has thousands of built-in procedures, but you may have tasks that are relatively unique or that you want done in a specific way.
If you have written a script to perform your task on a given dataset, it is easy to transform that script into something that can be used on all your datasets, on any set of variables, and on any set of observations.
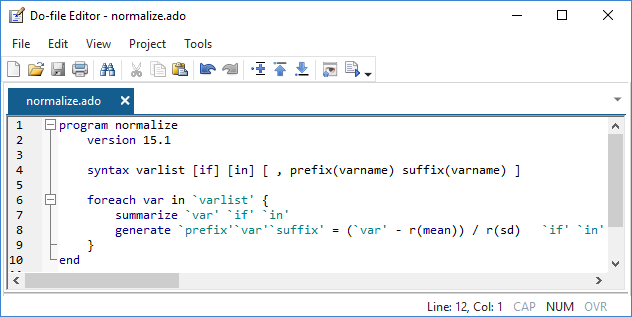
Easy to extend
Some of the things you automate may be so useful that you want to share them with colleagues or even make them available to all Stata users. That's also easy. With just a little code, you can turn an automation script into a Stata command. A command that supports standard features that Stata's official commands support. A command that can be used in the same way official commands are used.
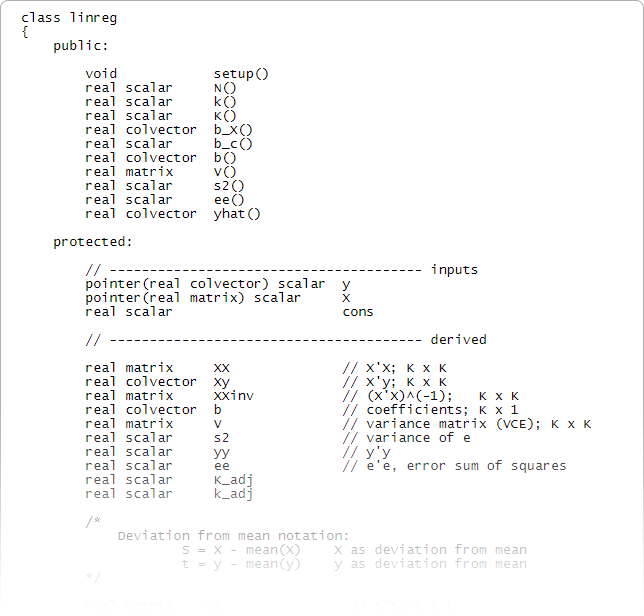
Advanced programming
Stata also includes an advanced programming language—Mata.
Mata has the structures, pointers, and classes that you expect in your programming language and adds direct support for matrix programming.
Though you don't need to program to use Stata, it is comforting to know that a fast and complete programming language is an integral part of Stata. Mata is both an interactive environment for manipulating matrices and a full development environment that can produce compiled and optimized code. It includes special features for processing panel data, performs operations on real or complex matrices, provides complete support for object-oriented programming, and is fully integrated with every aspect of Stata. Stata also has comprehensive Python integration, allowing you to harness all the power of Python directly from your Stata code.
Stata also has PyStata, which provides comprehensive Python integration, allowing you to harness all the power of Python directly from your Stata code and to harness all the power of Stata from your Python code.
Stata even let's you incorporate C, C++, and Java plugins in your Stata programs via a native API for each language. And you can even embed Java code directly in your Stata code!
Get the most out of your multicore computer.
No other statistical software comes close.
Enjoy the new features of Stata at top speed.
Community-contributed features
Stata is so programmable that developers and users add new features every day to respond to the growing demands of today's researchers.
With Stata's Internet capabilities, new features and official updates can be installed over the Internet with a single click.
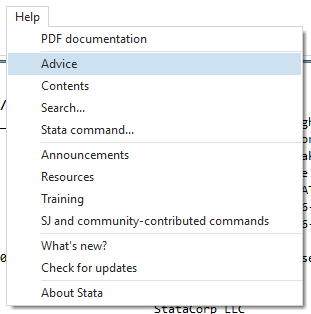
World-class technical support
All registered users of the current release of Stata (Stata 18) are eligible for free technical support. If you have not registered your copy of Stata, please fill out the online registration form.
We have a dedicated staff of expert Stata programmers and statisticians to answer your technical questions. From tricky data management solutions to getting your graph looking just right and from explaining a robust standard error to specifying your multilevel model, we have your answers.
Cross-platform compatible
Stata will run on Windows, Mac, and Linux/Unix computers; however, our licenses are not platform specific.
That means if you have a Mac laptop and a Windows desktop, you don't need two separate licenses to run Stata. You can install your Stata license on any of the supported platforms. Stata datasets, programs, and other data can be shared across platforms without translation. You can also quickly and easily import datasets from other statistical packages, spreadsheets, and databases.
Widely used
Used by researchers for more than 30 years, Stata provides everything you need for data science—data manipulation, visualization, statistics, and automated reporting.
Select your discipline and see how Stata can work for you.
Behavioral sciences
Education
Institutional research
Public health
Biostatistics
Epidemiology
Medicine
Public policy
Data science
Finance, business, and marketing
Political science
Sociology
Economics
Can't find your discipline? See who else is using Stata »
Stata is distributed in more than 180 countries. Our authorized distributors offer services such as basic technical support and training, and carry Stata inventory so delivery is fast.
Comprehensive resources
Video tutorials
Stata's YouTube channel is the perfect resource for new users to Stata, users wanting to learn a new feature in Stata, and professors looking for aids in teaching with Stata. We have over 300 videos on our YouTube channel that have been viewed over 6 million times by Stata users wanting to learn how to label variables, merge datasets, create scatterplots, fit regression models, work with time-series or panel data, fit multilevel models, analyze survival data, perform Bayesian analylsis, and use many other features of Stata. View the complete list of videos.
Stata Blog
We write the official Stata Blog, Not Elsewhere Classified (NEC), to share things we think you will find instructive, informative, or just plain entertaining. We have written about how to interpret statistical results; export results into Word, Excel, and LaTeX; perform Monte Carlo simulations; program your own estimators; and more. We also post service and product announcements. Individually signed, the articles in NEC are written by the same people who develop and support Stata.
Free Stata webinars
Stata webinars offer something for everyone. Those new to Stata will get a head start when they join our Ready. Set. Go Stata webinar. Both new and experienced users will want to join our Tips and Tricks webinar and our one-hour feature webinars; each one provides an in-depth look at one of Stata's statistical, graphical, data management, or reporting features.
Training
A multitude of training options are available to become proficient at Stata quickly. Stata provides hands-on classroom and web-based training courses, customized on-site training courses, and online training through NetCourses, webinars, and video tutorials.
Stata Press
Stata Press® publishes books, manuals, and journals about Stata and general statistics topics for professional researchers of all disciplines. Stata Press® publications, along with books recommended by StataCorp, can be found in the Stata Bookstore.
Stata News
The Stata News is a free publication with columns such as the popular In the Spotlight, where Stata developers give insight into specific Stata features, and the User's corner, where we share unique, helpful, and fun contributions from the user community. The News also contains announcements such as new releases and updates, training schedules, new books, Conferences, and Users Group meetings.
Stata Journal
The Stata Journal is a quarterly publication containing articles about statistics, data analysis, teaching methods, and effective use of Stata's language. The Journal publishes reviewed papers together with shorter notes and comments, regular columns, book reviews, and other materials of interest to researchers applying statistics in a variety of disciplines.
Vibrant community
Stata Conferences
Whether you are a beginner or an expert, you will find something just for you at Stata conferences, which are held each year in various locations around the world. These meetings showcase in-depth presentations from StataCorp experts and experienced Stata users that focus on helping you use Stata more effectively.
Statalist
A great resource for users is Statalist, a forum where more than 40,000 Stata users exchange roughly 4,500 postings and responses each month. Statalist is run and moderated by Stata users and maintained by StataCorp.
User comments
Our users love to share how great Stata is, so we'd like to show you! When we receive nice comments about Stata, we post them here. If you think Stata is great too, send us an email with your comment, and we may share it with the Stata community.
Affordable
Stata is not sold in modules, which means you get everything in one package!
Stata offers several purchase options to fit your budget. Annual and multiyear subscriptions ensure you always have access to the latest features. Contact a sales representative or browse our products to find out more about our affordable options. You can also download a product brochure.

Stata is a complete, integrated software package that provides all your data science needs—data manipulation, visualization, statistics, and automated reporting. Stata is not sold in modules, which means you get everything you need in one package.
Whether you're a student or a seasoned research professional, a range of Stata packages are available and designed to suit all needs.
All of the following editions of Stata have the same complete set of commands and features and manuals included as PDF documentation within Stata.
Stata/MP is the fastest and largest edition of Stata. Virtually any current computer can take advantage of the advanced multiprocessing of Stata/MP. This includes the Intel i3, i5, i7, i9, Xeon, and Celeron, and AMD multi-core chips. On dual-core chips, Stata/MP runs 40% faster overall and 72% faster where it matters, on the time-consuming estimation commands. With more than two cores or processors, Stata/MP is even faster.
Stata/MP is faster-much faster. Stata/MP lets you analyze data in one-half to two-thirds of the time compared to Stata/SE on inexpensive dual-core laptops and in one-quarter to one-half the time on quad-core desktops and laptops.
Stata/MP runs even faster on multiprocessor servers. Stata/MP supports up to 64 processors/cores.
Speed is often most crucial when performing computationally intense estimation procedures. A few of Stata's estimation procedures, including linear regression, are nearly perfectly parallelized, meaning they run twice as fast on two cores, four times as fast on four cores, eight times as fast on eight cores, and so on. Some estimation commands can be parallelized more than others. Taken at the median, estimation commands run 1.8 times faster on 2 cores, 2.9 times faster on 4 cores, and 4.1 times faster on 8 cores.
Stata/MP is 100% compatible other editions of Stata. Analyses do not have to be reformulated or modified in any way to obtain Stata/MP’s speed improvements.
Stata/MP is available for the following operating systems:
- Windows (64-bit processors);
- macOS (64-bit Intel processors);
- Linux (64-bit processors);
To run Stata/MP, you can use a desktop computer with a dual-core or quad-core processor, or you can use a server with multiple processors. Whether a computer has separate processors or one processor with multiple cores makes no difference. More processors or cores makes Stata/MP run faster.
For more advice on purchasing/upgrading to Stata/MP or for hardware queries, please contact our sales team.
Stata/SE and Stata/BE differ only in the dataset size that each can analyse. Stata/SE and Stata/MP can fit models with more independent variables than Stata/BE (up to 65,532). Stata/SE can analyse up to 2 billion observations.
Stata/BE allows datasets with as many as 2,048 variables. The maximum number of observations is 2.14 billion. Stata/BE can have at most 798 independent variables in a model.
Comparison of features
Product Features
Stata/BE (Basic Edition)
Stata/SE (Standard Edition)
Stata/MP
Multicore support
Time to run logistic regression with 5 million obs and 10 covariates Info1-core
10.0 sec1-core
10.0 sec2 core
5.0 sec4 core
2.6 sec4+
even fasterMatrix programming language
Exceptional technical support
Includes within-release updates
64-bit version available
Memory requirements
1 GB
2 GB
4 GB
Disk space requirements
2 GB
2 GB
2 GB
For Business License terms and options please click here.
For Educational License terms and options please click here.
New Features in Stata
Stata has something for everyone. Below we list the highlights of the latest Stata 18 release. This release is unique because most of the new features can be used by researchers in every discipline.
Modifying graphs using the Graph Editor New
Probit regression with categorical covariates New
Probit regression with continuous covariates New
Probit regression with categorical and continuous covariates New
What's it like–Getting started in Stata New
Tour of the Stata 18 interface New
PDF documentation in Stata 18 New
Tour of the Stata 18 interface
PDF documentation in Stata 18
Automatic production of web pages from dynamic Markdown documents
Create PDF reports from within Stata
Create Word documents from within Stata
Extended regression models (ERMs)
Finite mixture models (FMMs)
Heteroskedastic linear regression
Import FRED (Import Federal Reserve Economic Data)
Interval-censored survival models
Latent class analysis (LCA)
Linearized DSGEs
Mixed logit models
Multilevel tobit and interval regression
Multiple-group generalized SEM
Nonlinear mixed-effects models
Nonparametric regression
Panel-data cointegration tests
Poisson with sample selection
Power analysis for cluster randomized designs and linear regression
A prefix for Bayesian regression
Spatial autoregressive models
Tests for multiple breaks in time series
Threshold regression
Transparency in Stata graphs
Zero-inflated ordered probit
Loading, saving, importing, and exporting data
Import FRED (Import Federal Reserve Economic Data)
Copy/paste data from Excel into Stata
Import Excel data into Stata
Saving estimation results to Excel
Importing delimited data
Changing and renaming variables
Convert a string variable to a numeric variable
Convert categorical string variables to labeled numeric variables
Create a categorical variable from a continuous variable
Convert missing value codes to missing values
Combining data
How to merge files into a single dataset
How to append files into a single dataset
Creating and dropping variables
Create a new variable that is calculated from other variables
Identify and replace unusual data values
Create a date variable from a date stored as a string
Optimize the storage of variables
Round a continuous variable
Stata's Expression Builder
Examining data
Identify and remove duplicate observations
Labeling, display formats, and notes
Label variables
Label the values of categorical variables
Change the display format of a variable
Add notes to a variable
Reshaping datasets
Reshape data from wide format to long format
Reshape data from long format to wide format
Strings
Unicode
Tour of long strings and BLOBs
A prefix for Bayesian regression
Bayesian linear regression using the bayes prefix
Bayesian linear regression using the bayes prefix: How to specify custom priors
Bayesian linear regression using the bayes prefix: Checking convergence of the MCMC chain>
Bayesian linear regression using the bayes prefix: How to customize the MCMC chain>
Bayesian analysis
Graphical user interface for Bayesian analysis
Introduction to Bayesian statistics, part 1: The basic concepts
Introduction to Bayesian statistics, part 2: MCMC and the Metropolis-Hastings algorithm
Mixed logit models
Poisson with sample selection
Zero-inflated ordered probit
Logistic regression in Stata, part 1: Binary predictors
Logistic regression in Stata, part 2: Continuous predictors
Logistic regression in Stata, part 3: Factor variables
Regression models for fractional data
Probit regression with categorical covariates New
Probit regression with continuous covariates New
Probit regression with categorical and continuous covariates New
Linearized DSGEs
Nonparametric regression
Spatial autoregressive models
Heteroskedastic linear regression
Mixed logit models
Multilevel tobit and interval regression
Extended regression models (ERMs)
Extended regression models, part 1: Endogenous covariates
Extended regression models, part 2: Nonrandom treatment assignment
Extended regression models, part 3: Endogenous sample selection
Extended regression models, part 4: Interpreting the model
Probit regression with categorical covariates New
Probit regression with continuous covariates New
Probit regression with categorical and continuous covariates New
IRT (item response theory) models
Item response theory using Stata: One-parameter logistic (1PL) models
Item response theory using Stata: Two-parameter logistic (2PL) models
Item response theory using Stata: Three-parameter logistic (3PL) models
Item response theory using Stata: Nominal response (NRM) models
Item response theory using Stata: Rating scale (RSM) models
Item response theory using Stata: Graded response (GRM) models
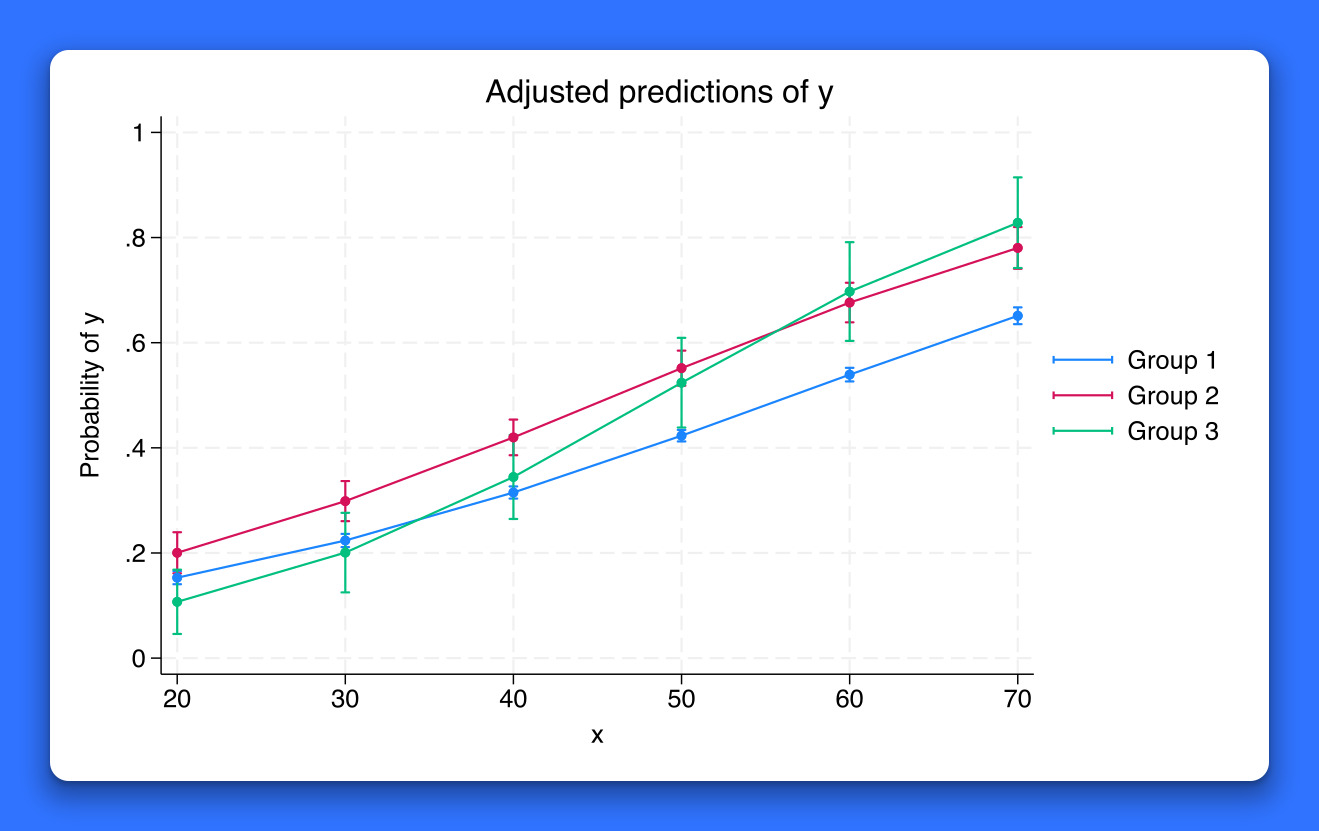
Introduction to margins in Stata, part 1: Categorical variables
Introduction to margins in Stata, part 2: Continuous variables
Introduction to margins in Stata, part 3: Interactions
Profile plots and interaction plots in Stata, part 1: A single categorical variable
Profile plots and interaction plots in Stata, part 2: A single continuous variable
Profile plots and interaction plots in Stata, part 3: Interactions of categorical variables
Profile plots and interaction plots in Stata, part 4: Interactions of continuous and categorical variables
Profile plots and interaction plots in Stata, part 5: Interactions of two continuous variables
Multilevel tobit and interval regression
Nonlinear mixed-effects models
Introduction to multilevel linear models, part 1
Introduction to multilevel linear models, part 2
Tour of multilevel GLMs
Multilevel models for survey data
Multilevel survival analysis
Small-sample inference for mixed-effects models
Power analysis for cluster randomized designs and linear regression
Tour of power and sample size
A conceptual introduction to power and sample size
New power and sample-size features in Stata 14
Sample-size calculation for comparing a sample mean to a reference value
Power calculation for comparing a sample mean to a reference value
Find the minimum detectable effect size for comparing a sample mean to a reference value
Sample-size calculation for comparing a sample proportion to a reference value
Power calculation for comparing a sample proportion to a reference value
Minimum detectable effect size for comparing a sample proportion to a reference value
How to calculate sample size for two independent proportions
How to calculate power for two independent proportions
How to calculate minimum detectable effect size for two independent proportions
Sample-size calculation for comparing sample means from two paired samples
Power calculation for comparing sample means from two paired samples
How to calculate the minimum detectable effect size for comparing the means from two paired samples
Sample-size calculation for one-way analysis of variance
Power calculation for one-way analysis of variance
Minimum detectable effect size for one-way analysis of variance
Basic introduction to the analysis of complex survey data
Specifying the design of your survey data
How to download, import, and merge multiple datasets from the NHANES website
How to download, import, and prepare data from the NHANES website
Multilevel models for survey data
Survey data support for SEM
Interval-censored survival models
Learn how to set up your data for survival analysis
How to describe and summarize survival data
How to construct life tables
How to calculate incidence rates and incidence-rate ratios
How to calculate the Kaplan-Meier survivor and Nelson-Aalen cumulative hazard functions
How to graph survival curves
How to test the equality of survivor functions using nonparametric tests
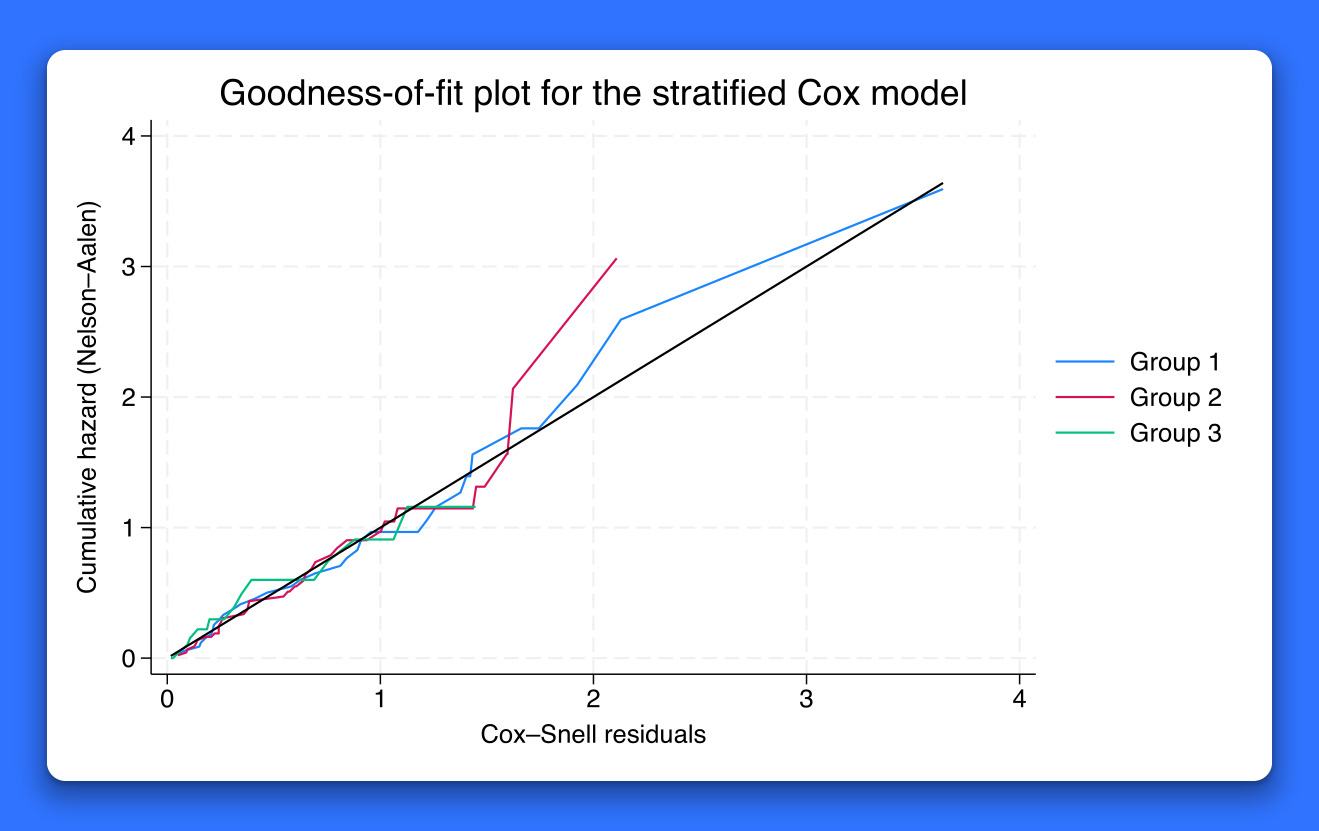
How to fit a Cox proportional hazards model and check proportional-hazards assumption
Multilevel survival analysis
Panel-data survival models
Survival models for SEM
Treatment effects for survival models
Import FRED (Import Federal Reserve Economic Data)
Threshold regression
Tests for multiple breaks in time series
Tour of forecasting
Formatting and managing dates
Time-series operators
Correlograms and partial correlograms
Line graphs and tin()
Introduction to ARMA/ARIMA models
Markov-switching models
Moving-average smoothers
Introduction to treatment effects in Stata: Part 1
Introduction to treatment effects in Stata: Part 2
Treatment effects: Regression adjustment
Treatment effects: Inverse-probability weighting
Treatment effects: Inverse-probability weighted regression adjustment
Treatment effects: Augmented inverse-probability weighting
Treatment effects: Nearest-neighbor matching
Treatment effects: Propensity-score matching
Treatment effects for survival models
Endogenous treatment effects
All editions of Stata run on dual-core, multi-core and multi-processor computers.
Stata for Windows: Stata requires 64-bit Windows for x86-64 processors made by Intel® and AMD
- Windows 11 *
- Windows 10 *
- Windows Server 2022, 2019, 2016, 2012R2
*Stata requires 64-bit Windows for x86-64 processors made by Intel® or AMD (Core i3 equivalent or better)
Stata for Mac
- Mac with Apple Silicon or 64-bit Intel processor
- MacOS 11.0 (Big Sur) or newer for Macs with Apple Silicon and MacOS 10.12 (High Sierra) or newer for Macs with 64-bit Intel processors
Stata for Linux
- Linux: Any 64-bit (x86-64 or compatible) running Linux.
- Minimum requirements include the GNU C library (glib) 2.17 or better and libcurl4
- For xstata, you need to have GTK 2.24 installed
Hardware requirements
- Minimum of 1 GB of RAM for Stata/BE, 2GB for Stata/SE and 4GB for Stata/MP
- Minimum of 2 GB of disk space for all editions
Find out all about Stata’s expansive range of statistical features using the table of contents below. Each section links to further details and examples to help users get the best out of their software.
https://www.timberlake.co.uk/software/stata/
Start AgainPlease select a user type:
Business Educational Students Upgrade Business and Educational The Stata Prof+ PlanPlease select a licence type:
Single User / Volume Single Users Network (Concurrent Users) Student LabPlease select an upgrade licence type:
Single User / Volume Single Users Network (Concurrent Use) Student LabI currently own a Stata license for:
Stata 18 Documentation
Every installation of Stata includes all the documentation in PDF format. Stata’s documentation consists of over 18,000 pages detailing each feature in Stata including the methods and formulas and fully worked examples. You can transition seamlessly across entries using the links within each entry.Stata Manuals
- Getting Started with Stata for Mac
- Getting Started with Stata for Unix
- Getting Started with Stata for Windows
- User’s Guide
- Reporting Reference Manual
- Choice Models Reference Manual
- Lasso Reference Manual
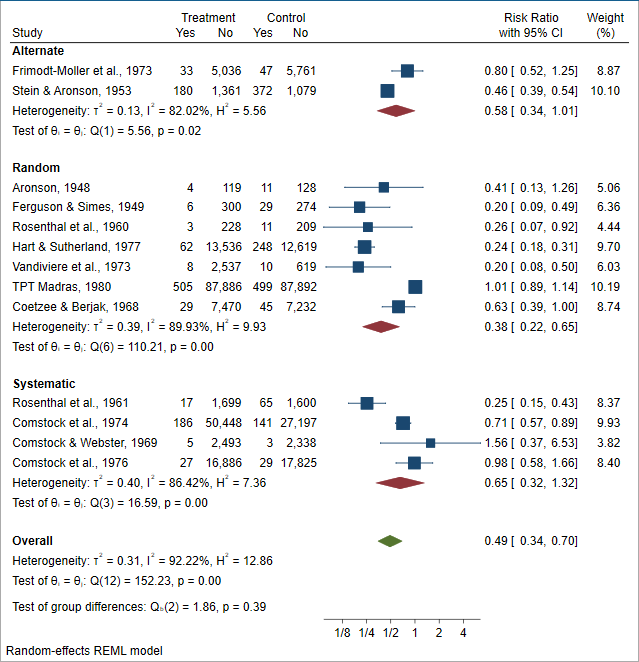
- Meta-Analysis Reference Manual
- Base Reference Manual
- Bayesian Analysis Reference Manual
- Data Management Reference Manual
- Functions Reference Manual
- Graphics Reference Manual
- Item Response Theory Reference Manual
- Longitudinal-Data/Panel-Data Reference Manual
- Mata Matrix Programming
- Multilevel Mixed-Effects Reference Manual
- Multiple-Imputation Reference Manual
- Multivariate Data Science Reference Manual
- Power and Sample-Size Reference Manual
- Programming Reference Manual
- Structural Equation Modeling Reference Manual
- Survey Data Reference Manual
- Survival Analysis Reference Manual
- Time Series Reference Manual
- Causal Inference and Treatment Effects Estimation Reference Manual
- Glossary and Index
- Extended Regression Models
- Finite Mixture Models
- Linearized Dynamic Stochastic General Equilibrium
- Spatial Autoregressive Models
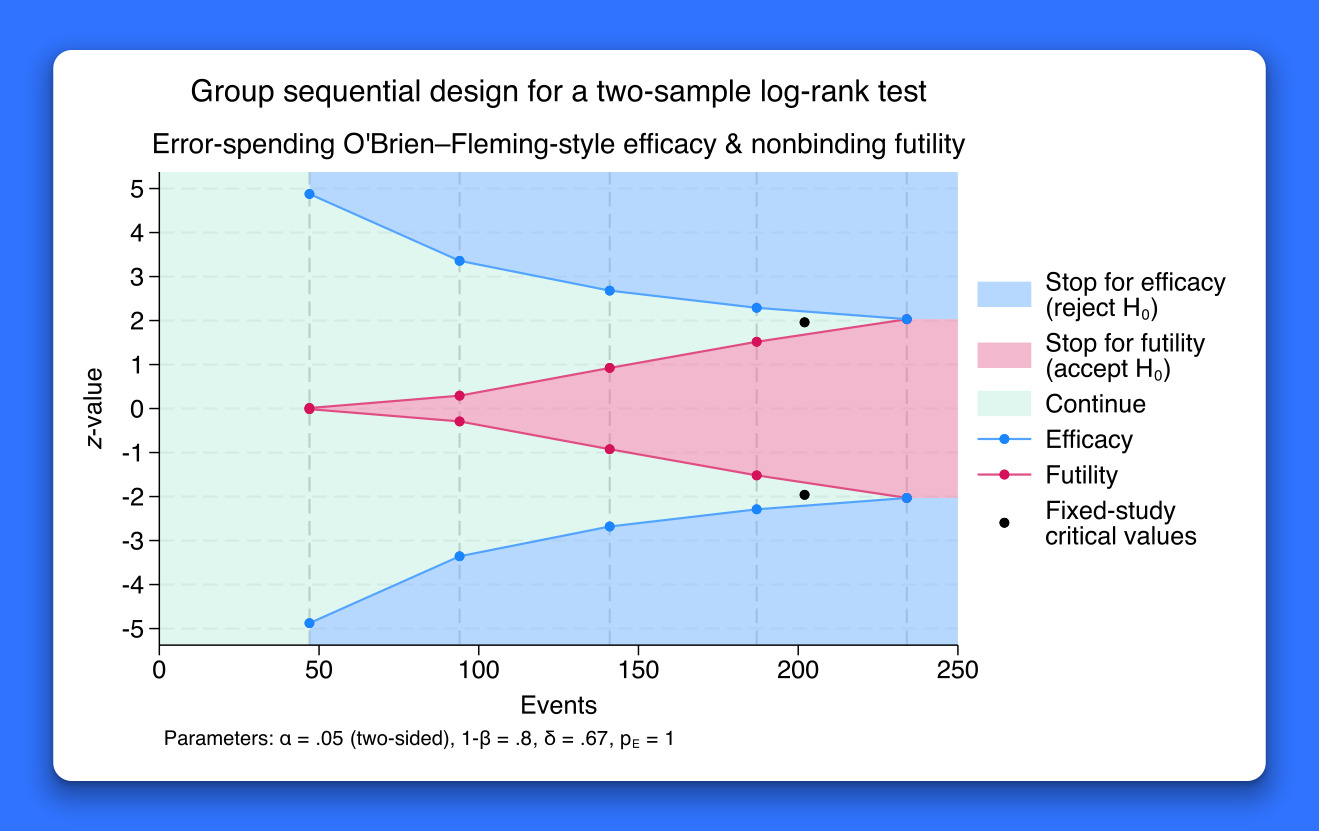
- Adaptive Design: Group Sequential Trials
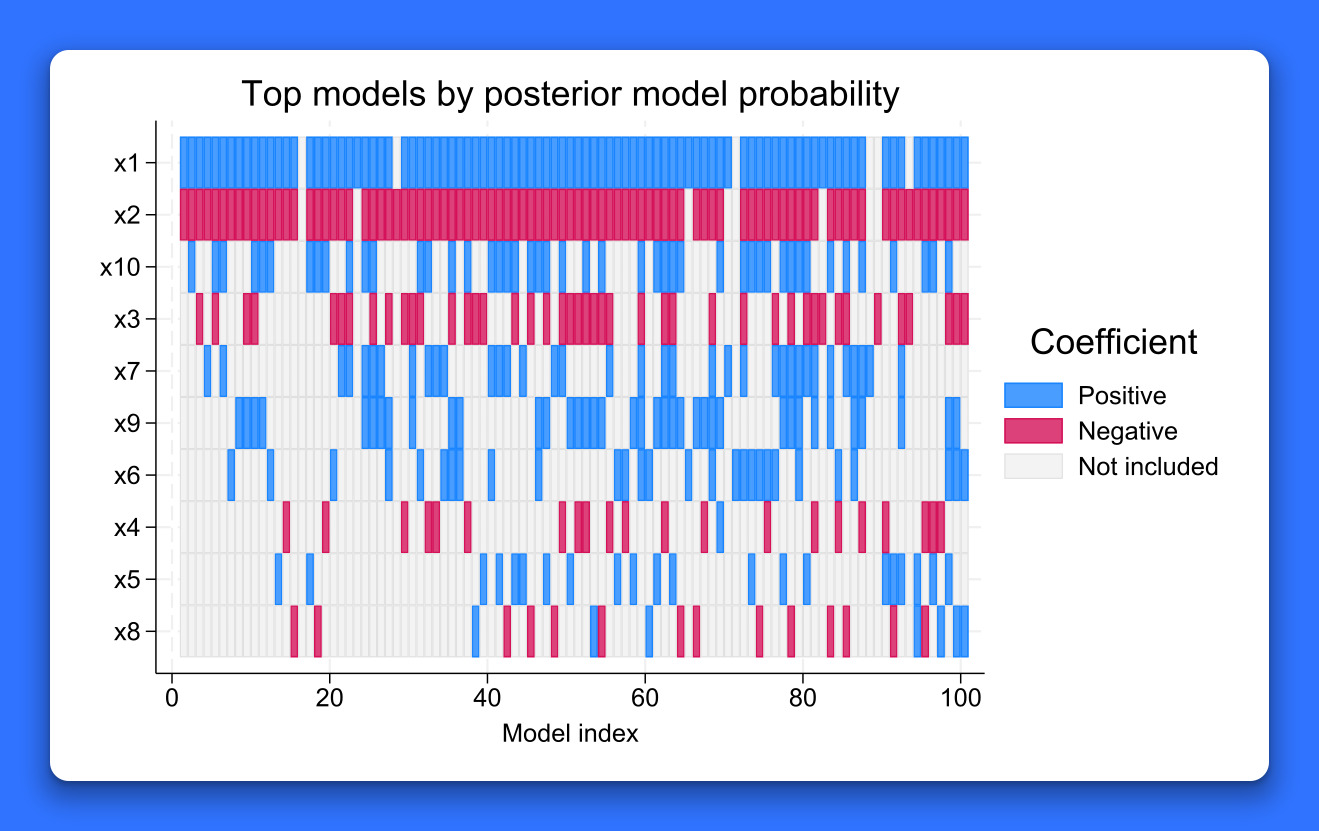
- Bayesian Model Averaging
The Stata documentation is copyright of StataCorp LLC, College Station TX, USA, and is used with permission of StataCorp LLC.
Students may purchase Stata/MP, Stata/SE and Stata/BE at a discounted price. To purchase Student Licenses, click here.