Stata Tips #7 - dyntext, dyndoc and user-written commands
One of the new features introduced in Stata version 15 is a series of commands allowing you to interweave Stata commands into text. You can run the commands and populate the text with the results.
This is useful, because it means that once you have a do-file perfected for analysing your data, it’s relatively easy to add the Markdown around that code, and enclose it in <<dd_do>> tags. Then, you are ready to produce good-looking output in HTML that is ready to distribute to colleagues or clients straight away; no more copying and pasting output.
The dyntext command
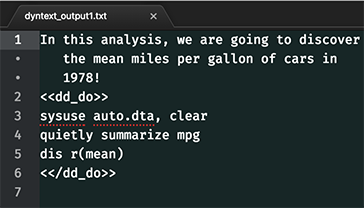
Let’s look at a basic example. If we write a simple plain text file called dyntext_output1.txt like this ...
... We can get Stata to read through it and actually run the commands inside this file. We type: dyntext "dyntext_output1.txt", saving("dyntext_output2.txt") replace
This new file dyntext_output2.txt appears:
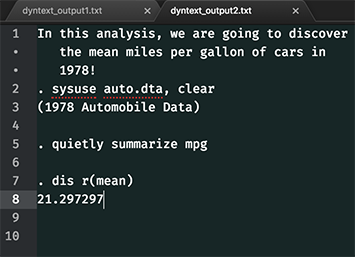
As you can see, the first sentence appears verbatim. Then, everything inside the dynamic tags has been executed and replaced with the logged results. Dynamic tags are new to Stata 15 and they power the dyntext and dyndoc commands. They are enclosed by two greater / less than signs like brackets: <<dd_do>> at the beginning and <</dd_do>> at the end. The oblique or slash (/) tells Stata that it is the end of a block of commands. In fact, <<dd_do>> is not the only tag you can use. I’ll explain what the others do, but first let’s look at the related command dyndoc.
The dyndoc command
Plain text files are sometimes useful, but are very limited. That’s why dyndoc does similar things, but creates an HTML file instead. HTML is the language that defines a lot of the visible content on web pages, so it is capable of very flexible and attractive formatting. To get that formatting in a plain text file, we use Markdown.
Markdown is a very popular shorthand for formatting text, and it has been widely adopted with many tools to convert it to HTML. Here’s a file called dyndoc_output1.md:

We can then run the command: dyndoc "dyndoc_output1.md", saving("dyndoc_output2.html") replace
If we open the resulting .html file, it should open in a web browser and look like this:
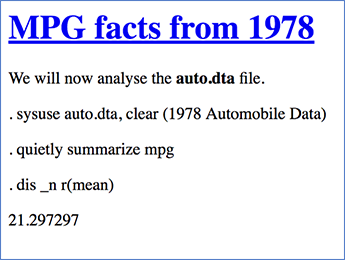
The exact look is determined to some extent by the browser and operating system you use. You can see that putting a row of equal signs under the first line is like doubly underlining it and that marks it as the biggest heading. By putting two asterisks before and after some text, we mark it to be bold. One asterisk before and after would mark it to be italic. There are many more options for Markdown and you can read about them at http://daringfireball.net/projects/markdown/.
Each browser has a way to view the underlying HTML source code for a web page, or you can just open the .html file in a text editor. Either way, if you look under the hood you will find this:
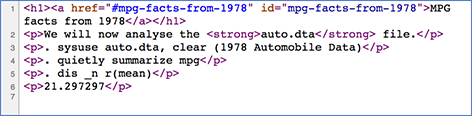
This is HTML, and you can see the tags such as <p> and </p> which indicate the start and end of a paragraph, or <strong> and </strong> for bold type. If you are familiar with this, you can edit the HTML further in a text editor or have it call a JavaScript program to make further edits or add interactivity. One fact worth clarifying is that .html files, even if they are viewed in the web browser, don’t have to be online – they can just be stored locally on your computer. This makes HTML a great format for sharing results: everybody has a web browser, they look good with little effort on your part, and you can include tables, images and hyperlinks. Let’s look at how you would do that with Stata dynamic tags.
Using dynamic tags in Stata
<<dd_display>> is a tag that can be used to insert any value held by Stata into the surrounding text. For example, we can change the line in our Markdown file that displays r(mean) to:
The mean MPG was <<dd_display: %8.2f r(mean)>>
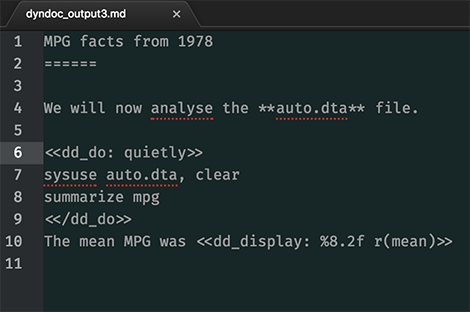
You might have noticed that we have also added quietly to the <<dd_do>> tag. This will now run the commands between <<dd_do>> and <</dd_do>>, but show us nothing of it in the HTML file. Then, we can use r(mean) in the <<dd_display>> tag, in a very similar way to Stata’s macro substitution, including formatting to 2 decimal places.
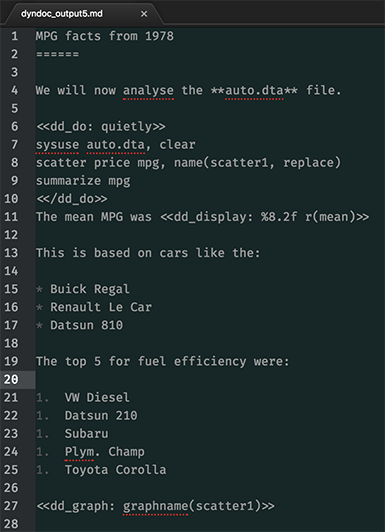
In this version of the Markdown file, we include an unordered list, an ordered list, and a graph using <<dd_graph>>:
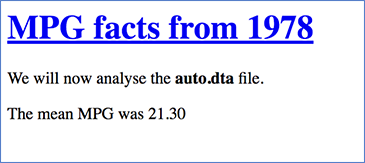
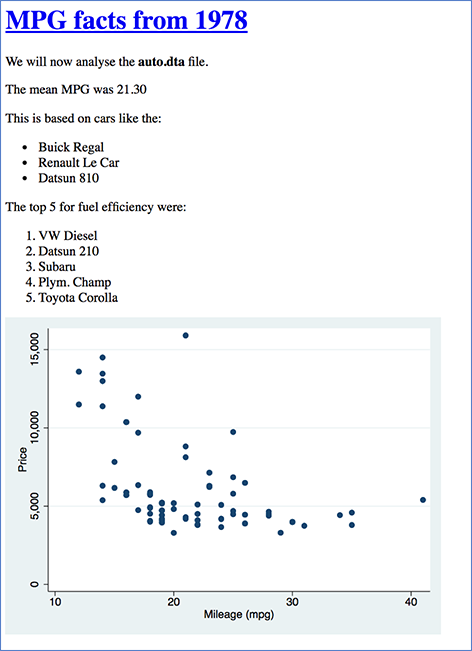
The HTML looks like this:
If you need to produce multiple outputs for different groups, each getting a different slice of the data, you can do this by wrapping all the <<dd_do>> commands in a loop.
Aren’t there already commands that do this?
There have been several user-written commands that aim to write out to HTML or TeX. StataCorp have taken the best ideas from each to create dyndoc with ease of use and flexibility, but one of the great advantages of Stata as a data analysis package is the ability to extend it with those user-written commands. So if dyndoc does not do exactly what you want, you may be able to achieve it with commands like webdoc, tabout, ht or htmlutil.